Command line scripts
Before any further calculations you can check and draw your pseudosection using psshow command which construct finished areas within your project. It has few options to label pseudosection with assamblages or highlight out phase lines.
$ psshow -h
usage: psshow [-h] [-o OUT [OUT ...]] [-l] [--origwd] [-b] [--cmap CMAP]
          [--alpha ALPHA] [--connect] [--high HIGH]
          [--tolerance TOLERANCE]
          project [project ...]

Draw pseudosection from project file

positional arguments:
  project               builder project file(s)

optional arguments:
  -h, --help            show this help message and exit
  -o OUT [OUT ...], --out OUT [OUT ...]
                        highlight out lines for given phases
  -l, --label           show area labels
  --origwd              use stored original working directory
  -b, --bulk            show bulk composition on figure
  --cmap CMAP           name of the colormap
  --alpha ALPHA         alpha of colormap
  --connect             whether mouse click echo stable assemblage
  --high HIGH           highlight field defined by set of phases
  --tolerance TOLERANCE
                        tolerance to simplify univariant lines
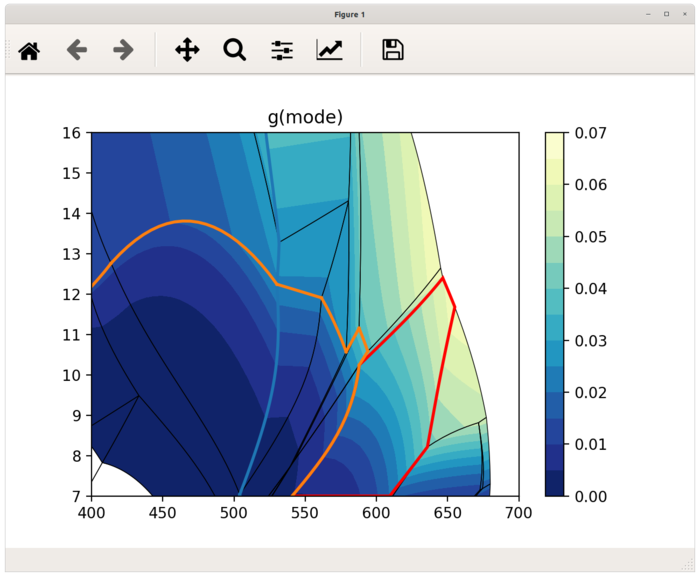
To draw pseudosection with marked epidote-out and chlorite-out lines execute:
$ psshow '/path/to/project.ptb' -o ep chl
Draw isopleths diagrams
To create isopleths diagrams the pseudoction should be gridded at first (In other case only values from univariant lines and invariant points are used and interpolated accross areas). Command psgrid will do all calculations and result are saved afterwards, so next time results are automatically loaded. Be aware that calculations takes some time.
$ psgrid -h
usage: psgrid [-h] [--nx NX] [--ny NY] [--origwd] [--tolerance TOLERANCE]
              project [project ...]

Calculate compositions in grid

positional arguments:
  project               builder project file(s)

optional arguments:
  -h, --help            show this help message and exit
  --nx NX               number of T steps
  --ny NY               number of P steps
  --origwd              use stored original working directory
  --tolerance TOLERANCE
                        tolerance to simplify univariant lines
For gridding pseudosection with grid 50x50 run following command:
$ psgrid '/path/to/project.ptb' --nx 50 --ny 50
            Gridding: 100%|█████████████████████████████| 2500/2500 [01:30<00:00, 27.62it/s]
            Grid search done. 0 empty grid points left.
Once gridded you can draw isopleths diagrams using psiso command:
            $ psiso -h
usage: psiso [-h] [-e EXPR] [-f] [--origwd] [-o OUT [OUT ...]] [--nosplit]
             [-b] [--step STEP] [--ncont NCONT] [--colors COLORS]
             [--cmap CMAP] [--smooth SMOOTH] [--labelkey LABELKEY]
             [--high HIGH] [--tolerance TOLERANCE]
             project [project ...] phase

Draw isopleth diagrams

positional arguments:
  project               builder project file(s)
  phase                 phase used for contouring

optional arguments:
  -h, --help            show this help message and exit
  -e EXPR, --expr EXPR  expression evaluated to calculate values
  -f, --filled          filled contours
  --origwd              use stored original working directory
  -o OUT [OUT ...], --out OUT [OUT ...]
                        highlight out lines for given phases
  --nosplit             controls whether the underlying contour is removed or
                        not
  -b, --bulk            show bulk composition on figure
  --step STEP           contour step
  --ncont NCONT         number of contours
  --colors COLORS       color for all levels
  --cmap CMAP           name of the colormap
  --smooth SMOOTH       smoothness of the approximation
  --labelkey LABELKEY   label contours in field defined by set of phases
  --high HIGH           highlight field defined by set of phases
  --tolerance TOLERANCE
                        tolerance to simplify univariant lines
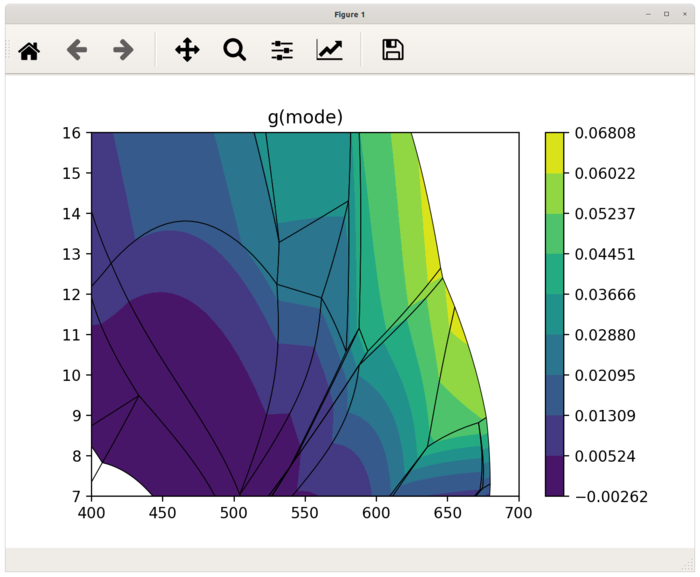
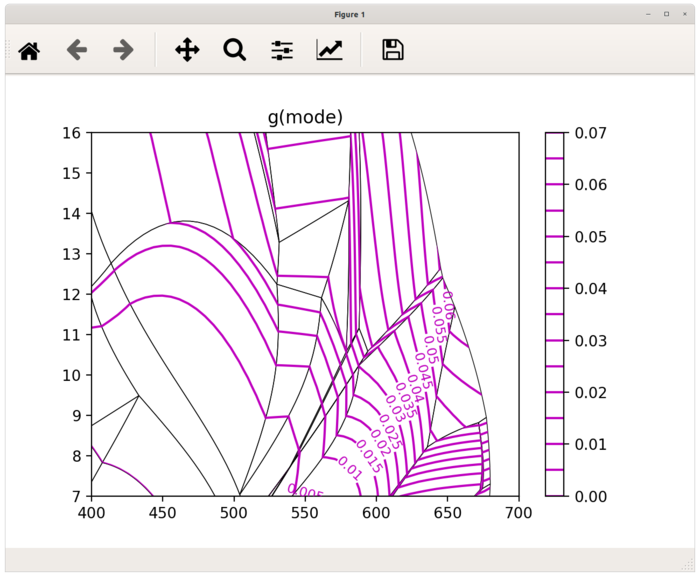
Following example shows isopleths of garnet mode:
$ psiso '/path/to/project.ptb' -f g -e mode
If the expression argument is not provided, the psexplorer shows list of
all calculated variables available for given phase.
$ psiso '/path/to/project.ptb' -f g
Missing expression argument. Available variables for phase g are:
mode x z m f xMgX xFeX xMnX xCaX xAlY xFe3Y H2O SiO2 Al2O3 CaO MgO FeO K2O
Na2O TiO2 MnO O factor G H S V rho
To draw isopleths of almandine garnet proportion you can use expression from a-x file alm = x + (-m) x + (-x) z:
$ psiso '/path/to/project.ptb' -f g -e 'x-m*x-x*z'
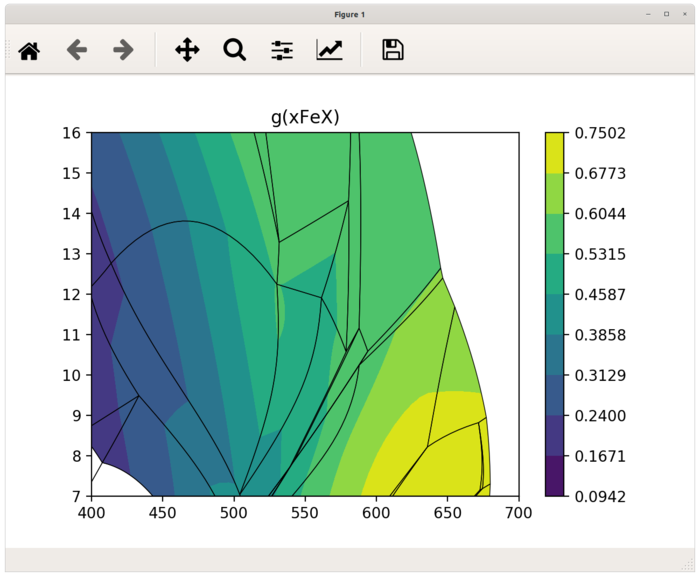
or use variable xFeX:
$ psiso tutorial.ptb -f g -e xFeX
If you need to label contour lines, you can use labelkey option to define field, where contour labels are plotted.
$ psiso '/path/to/project.ptb' g -e mode --labelkey "H2O bi g mu pa pl q ru"
            --step 0.005 --colors m
Another example of some other options.
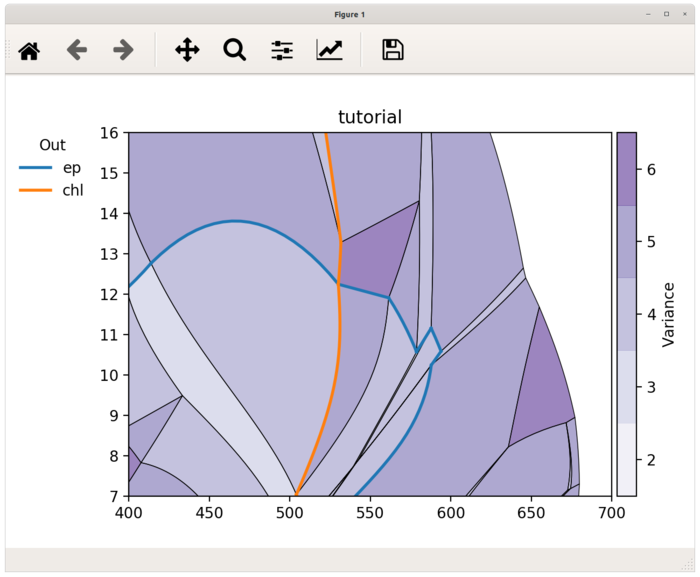
$ psiso tutorial.ptb -f g -e mode --step 0.005 --high "H2O bi g mu pa pl q ru"
--out chl ep --cmap YlGnBu_r